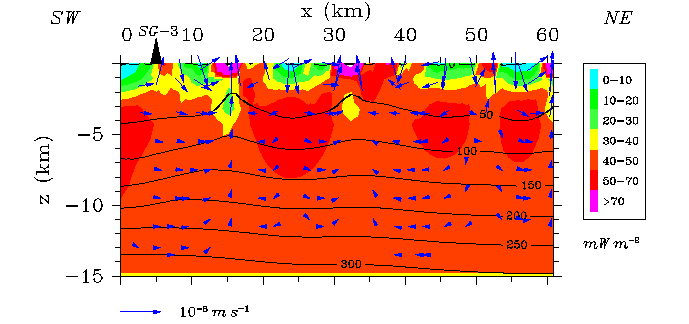
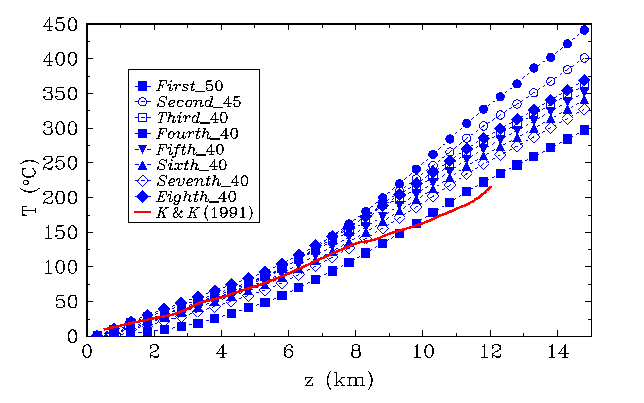
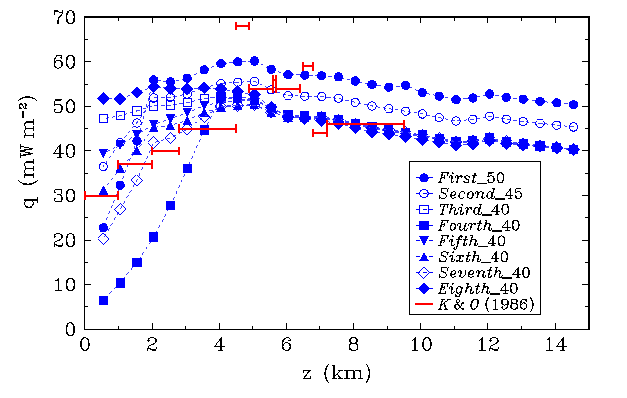
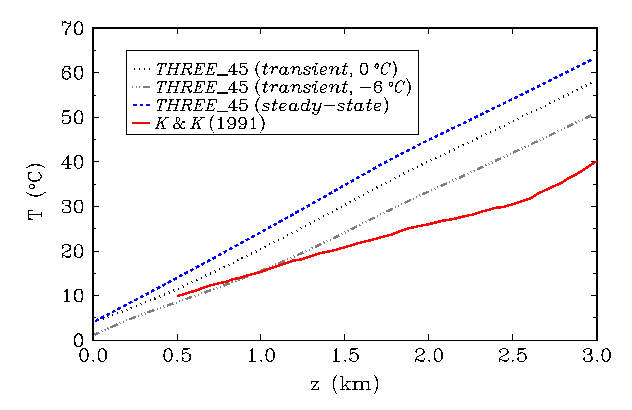
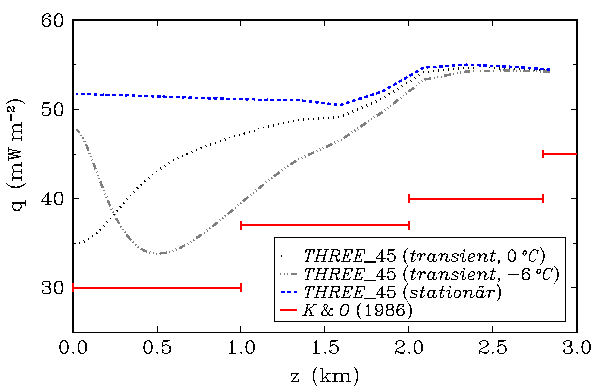
Abstract: The drill hole SG-3, 12261 m deep in the Pechenga-Zapolyarny area, Kola Peninsula, Russia, is currently the deepest drill hole in the world. Geothermal measurements in the hole reveal a considerable variation (30-68 mW m-2) with depth in the vertical component of heat flow density (HFD). We simulate heat and fluid flow in the bedrock structure of the Kola deep hole site. Various potential sources for the observed HFD variation are discussed, with special emphasis on advective heat transfer, paleoclimatic ground surface temperature changes and refraction of heat flow due to thermal conductivity contrasts. A two-dimensional finite difference (FD) porous medium model of the Kola structure, constructed from all available data on lithology, hydrogeology, topography, thermal conductivity and heat production rate in the deep drilling area, is the basis of all forward model calculations. A conductive, steady-state simulation indicates that heat production and refraction create a variation of about 15 mW m-2 in the uppermost 15 km, but are insufficient to reproduce the measured HFD-depth curve in the uppermost 2-4 km. However, if topography-driven groundwater flow is considered in the model the measured HFD variation is easily explained. The most sensitive parameters in fitting the model results to the observed HFD-depth curve are the permeability of the top 4 km (10-14 - 10-15 m2) and the (constant) HFD applied at the base of the model at 15 km depth (40-50 mWm-2). The paleoclimatic effect for the Kola structure was calculated with a conductive transient simulation. A simplified ground surface temperature history (GTH) of the Kola area was simulated by varying the model's surface temperatures during different intervals of the simulation. Our results indicate that the measured variation in the vertical HFD cannot be explained by the paleoclimatic effect alone, because its amplitude decreases rapidly from about 16 mW m-2 near the surface to less than 2 mW m-2 at depths in excess of 1.5 km.
